Click Here To View the Dashboard
Our new interactive dashboard allows users to explore the number and chemical concentrations of fish collected around the Kalamazoo Watershed! The dashboard shows information obtained by a request made to the Michigan Department of Environment, Great Lakes, and Energy (EGLE) for data on Polychlorinated biphenyls (PCBs), Perfluoro octane sulfonate (PFOS), and mercury in fish tissue collected within the Kalamazoo River watershed. Below are a few examples of how to use the dashboard.
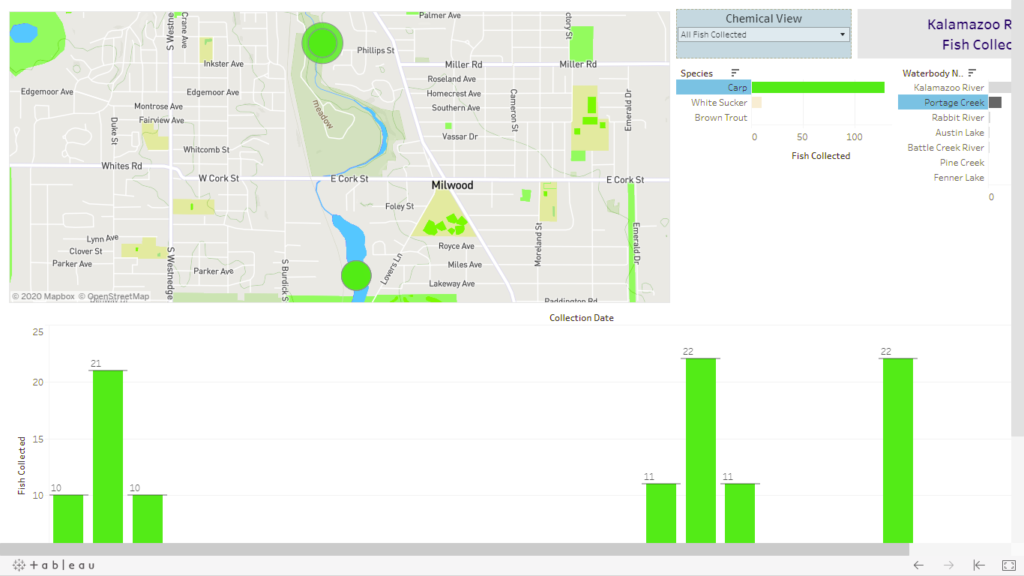
View Where and When Fish Were Collected
Users can get detailed information about the number of a certain species of fish collected from different locations within the watershed. For example, by clicking on Carp and Portage Creek on the bar chart menus with the “Chemical View” dropdown set to “All Fish Collected”, the dashboard will filter accordingly, showing only the number of carp collected in each year from Portage Creek.
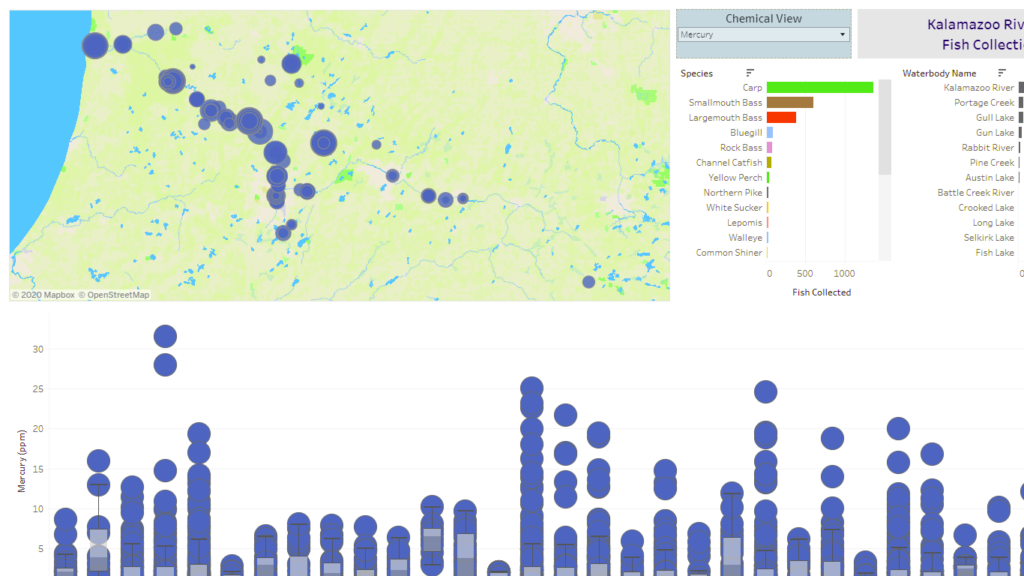
View Fish Tissue PCB, PFOS, and Mercury Concentrations
By selecting a specific chemical in the “Chemical View” dropdown menu (e.g., “Mercury”), users can view the concentration of that chemical found in all fish samples collected in the watershed. An individual fish species and water body within the watershed can also be selected.
Click Here To View the Dashboard
The State of Michigan Department of Health and Human Services has developed “Eat Safe Fish” (ESF) guidelines for several chemical contaminants, including the ones shown in this dashboard. Current guidelines for all waters of the state can be obtained HERE. From the Eat Safe Fish Guides web page, click on the map of southwest Michigan counties to obtain the Eat Safe Fish guide for rivers and lakes in our region and the Kalamazoo River watershed. You can also view our summary of the 2023 ESF guides for the mainstem of the Kalamazoo River HERE.
Dashboards created in partnership with Avalanche Data.